Headline findings from the test
A large-scale continuous tracking survey of radio and TV
This Millward Brown study involved nearly 5500 interviews in continuous research to track awareness and attitudes to 17 brands. The media tested were Commercial Radio and TV in the Central Region.
Adding radio to TV has a 15% multiplier effect
If 10% of a given TV budget is re-deployed onto radio, the efficiency of the campaign in building awareness increases on average by 15%
Radio in isolation was measured to be three-fifths as effective as TV at raising advertising awareness
On average, in this test, radio was three-fifths as effective as TV at increasing advertising awareness amongst an audience of 16-44 year old radio listeners
But this radio effectiveness result was achieved at one-seventh of the cost
On average, in this test, radio prices were about one-seventh of those for ITV. While the price relativity for other audiences will vary, the achievement of three-fifths of the result at one-seventh of the cost makes radio significantly more cost effective than ITV
More effective radio campaigns
The most effective radio campaigns outperformed even the average for TV. Enjoyability is an important factor but, above all, the best-performing ads are well branded
Misattribution
There is clear evidence that consumers often think they have seen a campaign on TV when in fact radio was the only advertising medium used; splitting the sample into listeners and non-listeners helps to offset this misattribution
Executive summary
This study was devised to find out how effective radio advertising can be relative to TV, and to learn more about what kind of radio advertising is more effective: effectiveness was gauged in terms of measuring increases in advertising awareness.
The study tracked perceptions amongst consumers aged 16-44 for seventeen brands advertised in two comparable regions, Derby and Coventry (both in the Central ITV area). For each brand, one town had radio advertising while the other did not. TV advertising was the same across both towns.
Millward Brown, who conducted the study across October 1999 to April 2000, model effectiveness in terms of the Awareness Index (see Awareness Index).Across the seventeen brands:
the average Awareness Index for radio was 3
the average Awareness Index for TV was 5
Therefore radio was, on average, three-fifths as efficient as TV at driving advertising awareness amongst radio listeners.In terms of price Universal McCann, who planned the campaigns, advise that for 16-44s Central ITV is around seven times the cost of radio. So, by achieving three fifths of the awareness at one seventh of the cost, the radio campaigns were significantly more cost-efficient than the TV campaigns. Obviously price variance between radio and TV will vary depending on area and audience.
This cost effectiveness advantage means that radio has a multiplier effect when added to a TV schedule. If 10% of a given TV budget is re-deployed onto radio, the efficiency of the campaign in building awareness increases on average by 15%.Some radio campaigns performed much more strongly than others indeed the strongest outperformed the TV average.
Radio campaigns with higher scores were characterised by good branding – these were campaigns where consumers were in little doubt which brand was being advertised. Enjoyability was also a characteristic of the better performing campaigns, although this could not overcome weak brand linkage.Branding and enjoyability appear to be significantly more important factors than spot length or media laydown.
Proprietary branding devices (e.g. jingles, theme music) were strong contributors to the effectiveness of radio advertising, even though they may have originally been established on TV.
Misattribution is an important issue. Consumers may think they have seen a campaign on TV even when it has only run on radio. This has important implications for measuring the effect of radio most importantly, research samples need to be split into listeners and non-listeners.
Introduction
There used to be a recurring question about radio amongst advertisers in the early days “does it work?”That question is now seldom asked, as there is plenty of evidence available now about radios effectiveness. The main body of it is accessible at the Case Study Database at RAB Online where there are also insights into the strategic roles for the medium, on its own or in combination with other media.
In addition there are the ingenious research studies from the past, such as the Impact Studies (1987 and 1997) which both suggested that radio was 80% as effective as TV in terms of generating short-term ad recall. There were also the famous Ironing Board Studies (1981 and 1995) which showed the surprising extent to which people listen even when distracted and also the huge difference that creativity makes to memorability.
But with radios increased acceptance as a mainstream advertising medium a new, more precise question emerged “Just how effective is radio, on its own and in combination with other media?”In effect “other media” normally meant TV, as TV was the only medium where significant norms had been established for effectiveness. So that was the start point for this project, which is also the most expensive single research study conducted by the RAB, coming in at around 140,000.
In terms of conclusions: the way radio has a multiplier effect when added to TV campaigns is illuminating, and confirms what was already widely thought. The finding that radio is so much more cost-effective than TV is extremely pleasing, although its important to note that relative cost-effectiveness will vary according to target audience. It is also important that this is a result based on averages some TV campaigns were significantly less effective, some radio campaigns performed much better than others (campaign identities are confidential).
As ever, the challenge is to make sure your own campaign is at or near the top of the category. In terms of creativity, there is some help and encouragement here in the findings, as branding and likeability are significant characteristics of the more effective campaigns.
How the study was carried out
In simplified terms this study, which was conducted by Millward Brown, consisted of continuously tracking consumer awareness and attitudes for brands advertised in two comparable regions Derby and Coventry, both in the Central ITV region.
There were seventeen brands in total, and nearly 5500 telephone interviews were conducted amongst people aged 16-44 over the half-year survey (October 1999 April 2000).For each brand, one of the two towns received radio advertising, while the other did not. TV advertising was common across both areas.
This allowed Millward Brown to identify, in terms of advertising awareness, how much effect was generated by radio, and how this compared to awareness generated by TV advertising.
Diagnostic questions about specific commercials also allowed Millward Brown to identify characteristics of the better-performing campaigns.For more precise explanation of the research method, see Appendix.In this study advertising awareness is calibrated using Millward Browns Awareness Index, which measures any change in advertising awareness following campaign activity.
The Millward Brown Awareness Index (A.I.) is the percentage rise in total advertising awareness, from a base level, that results from a hundred ratings of advertising activity.Ratings are a measure of advertising weight, reckoned by multiplying coverage (the number of people exposed to the campaign) by frequency (the number of times they are exposed).
For a fuller explanation of the Awareness Index click here.
The effect of radio advertising in isolation
During the period over which the research was conducted, seven of the brands were tracked when they were only advertising on radio. Although radio-only campaigns are not necessarily typical, for the purposes of research these brands make it possible for uncomplicated analysis into radio advertising effectiveness; there is no need to take account of possible influences resulting from activity taking place in other media.
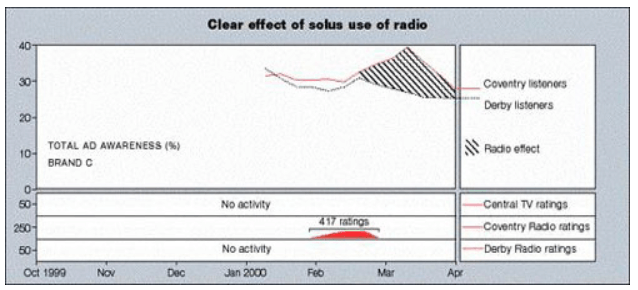
The results of the study demonstrate that radio advertising can work alone at building advertising awareness.Brand C is one for which the evidence is clear.
Up until the very end of January 2000, Brand C had had no media activity within the Midlands area for some 8 months. During February, however, although the brand continued not to use TV, a four-week burst of medium weight radio activity took place in Coventry. In contrast, there was no radio advertising for the brand in Derby. Therefore, for the purposes of the research Coventry acted as the test area, whilst Derby was the control area.
As Chart One demonstrates, when the responses from radio listeners in both areas are compared, a clear uplift in total advertising awareness can be seen in the test area – the area in which radio was present (note that the advertising awareness lines are based on four week rolling data, so a slight lag shows in the graphs).
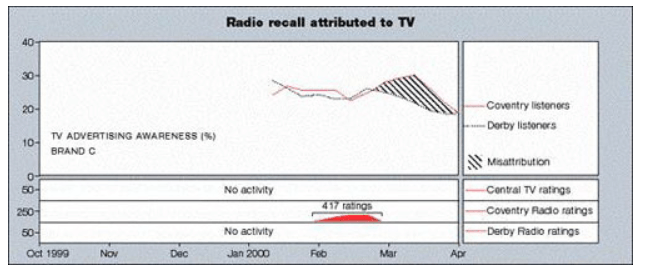
Interestingly, when respondents within Coventry were asked to say where they had seen or heard the advertising for Brand C, as Chart Two reveals, a significant proportion cited TV as the source. Clearly those respondents reporting that they had recently seen advertising for Brand C on TV were mistaken, since there was no television activity and there was no such movement in the Derby area. Therefore this finding confirms that consumers are prone to misattributing the source from which they receive advertising, an aspect which is discussed in greater depth in Implications for radio research
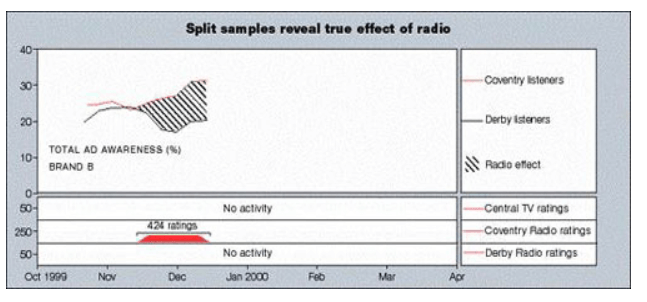
A similar pattern of uplift is seen for Brand B. Prior to going on radio in Coventry towards the end of 1999, this brand had had no media activity for several months. There was no radio activity in Derby during the whole of the research period and so once again Derby served as the control area.
Chart Three shows that up until the start of the radio activity, levels of total advertising awareness were similar in both Derby and Coventry. However, once the radio campaign begins, there is a clear move upwards in awareness levels among respondents in Coventry. In contrast, levels of advertising awareness in the control area continue to decline during the run up to the Christmas break.
This clearly demonstrates that, despite misattribution in consumers minds, splitting the sample does help to reveal the true effect of radio: the Coventry effect would only have been caused by radio.
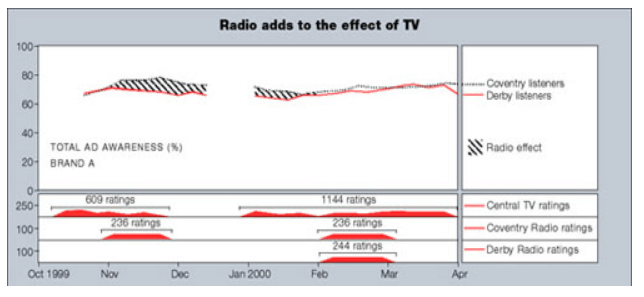
The results also show that radio can have an additive effect on advertising awareness, over and above the effect of a TV campaign which is running at the same time.
Brand A is one which ran TV and radio at the same time see Chart Four. In Coventry, the radio area, total advertising awareness rises higher in the pre-Christmas period, and the hatched area on the chart identifies this. The difference is relatively small, but this to be expected as the majority of radio listeners will already have been reached by the TV advertising (it should also be noted that this is a household brand with an awareness level which is already very high and therefore harder to increase).
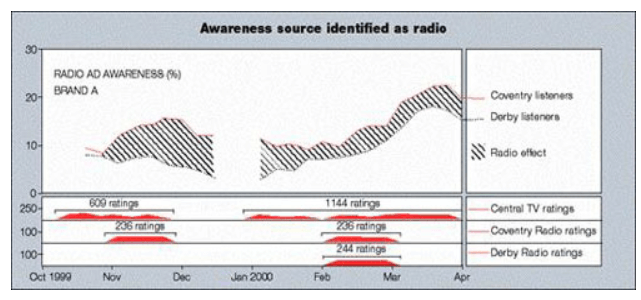
It is also very clear for this brand that the difference has been created by radio advertising. As Chart Five shows, there is a very visible uplift in Coventry in terms of radio advertising awareness during the first stage of the campaign.
Radio and TV effectiveness compared
Whle tracking charts make it fairly easy to demonstrate the relationship between media activity and advertising awareness, it is difficult to form a view about the comparative effectiveness of different brands advertising by looking at tracking charts alone.
In order to provide a currency for comparing advertising effectiveness between brands, Millward Brown have developed a model designed to relate movements in advertising awareness to the weight and timing of any advertising activity for a brand.The result is expressed in terms of an Awareness Index (A.I.) which can be compared not only across different creative treatments and brands, but also across media (the Awareness Index is explained in more detail in the panel).
The table below summarises the results for sixteen of the seventeen brands that participated in this study. (It was not possible to calculate an A.I. for one of the brands because the radio activity for the brand was already running at the moment when the research fieldwork started.) Two features in particular are worth noting.
Firstly, the average A.I. score for all of the radio campaigns tracked is three, whilst for TV the equivalent figure is five. This suggests that an average radio campaign is three-fifths as effective as TV at raising levels of advertising awareness.
Secondly, the A.I. scores for radio vary by brand/creative treatment. The conclusion here is that a good radio campaign can be as effective as an average TV campaign.
| Radio Awareness Index | TV Awareness Index | |
|---|---|---|
| Brand A | 6 | 4 |
| Brand B | 5 | No TV |
| Brand C | 5 | No TV |
| Brand D | 4 | No TV |
| Brand E | 3 | 3 |
| Brand F | 3 | No TV |
| Brand G | 3 | 4 |
| Brand H | 3 | 6 |
| Brand I | 3 | 6 |
| Brand J | 3 | 5 |
| Brand K | 3 | 8 |
| Brand L | 2 | 4/10 |
| Brand M | 2 | No TV |
| Brand N | 2 | 6 |
| Brand O | 2 | No TV |
| Brand P | 1 | 3 |
| Average | 3 | 5 |
It is also important that most of the brands that participated have, at some point or another, had exposure on TV. Indeed several of the brands are comparatively heavy users of TV. This means that none of the brands were starting from scratch – the radio advertising was able to adopt the branding mechanisms used previously in TV campaigns and in this respect, some of the radio campaigns tracked by this research have benefited from brands past advertising history.
The Millward Brown Awareness Index (A.I.) is the percentage rise in total advertising awareness, from the base level, that results from a hundred ratings of advertising activity.The base level is the measure of residual, or underlying, awareness that exists because of past advertising by the brand. In other words, it is an estimate of the level of claimed advertising awareness that would exist even if there had been no recent advertising activity.
Therefore, the Awareness Index calculation strips out the effects of past advertising and measures only the effects of current advertising activity. In short, the Awareness Index is an ads ability to build new advertising awareness.
Effectiveness versus cost-effectiveness
The average Awareness Indexes for radio & TV do not take account of the difference in media costs.
For the 16-44 target audience in the study Universal McCann, who planned and implemented the campaigns, advise that airtime on Central ITV is around seven times the price of radio.
At face value this leads to an equation that reads “radio offers three-fifths of the advertising awareness effect for one-seventh of the price of TV” radio could be described as approximately four times as cost-effective as TV (three-fifths divided by one-seventh equals just over four).
However there are some important variables to add in to this simplified equation.
The first is that the price of both radio and TV can vary widely by region and audience.
The second is that some of the successful radio campaigns in this study used branding devices (jingles, theme music etc) which had already been established, in some cases by television campaigns in the first place so in a sense this is not a “pure” test of either TV or radio.
The third is that ITV can reach a larger absolute number of consumers than can radio.
But, probably most importantly, the equation is based purely on averages some radio campaigns perform as well as the TV average, some TV campaigns scored much lower than others.So it would be fair to draw the conclusion that, while radio is likely to be significantly more cost-effective than TV for most audiences, the multiple of difference will vary widely.
The multiplier effect: Adding radio to a TV campaign
Using the findings about the relative efficiency of radio and TV advertising, it is possible to quantify the “media multiplier” effect of adding radio to a TV campaign.
It is a long-established media planning convention to maximise TV campaign effectiveness by taking a portion of the TV budget and re-deploying it in another complementary medium (not necessarily radio). This study allows us to gauge the true effect of applying this favoured technique to radio.
How the calculation works
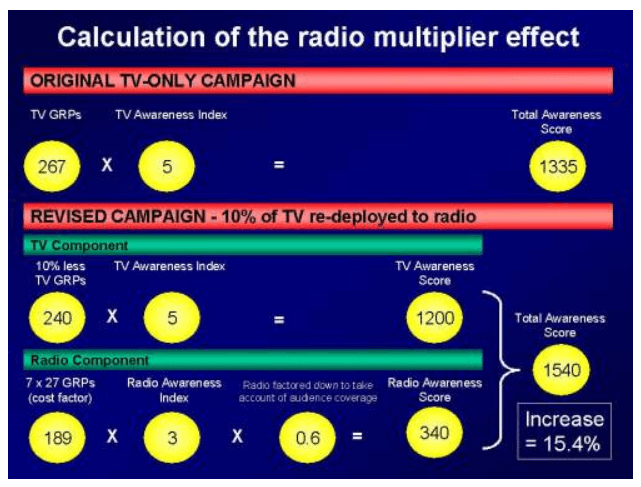
The original TV-only campaign in the example below had a weight of 267 ratings (or GRPs). Given that the average TV Awareness Index is 5, this gives a total awareness score of 1335 (267 x 5).
The revised campaign shows what happens when 10% of those TV ratings (27) are taken from TV and re-deployed to radio because of the seven-fold price differential in the test, this amounts to 189 radio GRPs (27 x 7). This is multiplied by the average radio Awareness Index, then Millward Brown also apply a reducing factor of 0.6 to take account of the fact that radios total reach in the region is 60% of that for TV. Altogether this gives a total awareness score for radio of 340, while the remaining 90% of the TV activity delivers an awareness score of 1200.
Added together, the radio and TV scores (340 and 1200) amount to a total campaign awareness score of 1540 15.4% higher than the original 1335 for the TV-only campaign.
This example has been worked out on the basis of a given brand re-deploying 10% of its TV budget to radio, and assumes the same price differential as in the test. The effect for different brands, and under different conditions, will naturally vary – Millward Brown can offer advice on this.
Attributes of more effective radio campaigns
Diagnostic measures
The fact that the Awareness Index varied from brand to brand means that some advertisements were better able to lodge themselves in consumers minds than were others.
In an attempt to tease out the types of creative element which might be most influential at effecting levels of advertising recall, a number of diagnostic measures were included on the questionnaire. These were:
Ad recognition
“Have you heard this ad before today?”
Enjoyment / likeability
“How much will you enjoy hearing this advert each time you hear it on the radio?”
Branding
“The advert was for Brand X. There are some adverts that people remember but never know which brand they are for. Which of these phrases applies to this advert?” (Series of phrases representing different scales of brand recognition then given).
Ease of visualisation
“Some radio advertisements create strong impressions so that you can easily picture whats happening, whilst others are far more difficult to picture. How easy is it to picture whats happening in this ad?”
Attitudes towards the brand
“I am going to read you some phrases and for each one please tell me whether or not you feel it applies to this advert.”
Similarity to any TV advertising
“How much does this advert remind you of a TV ad for the same brand?”
Whilst it would be unwise to conclude that the results to the diagnostics provide a definitive template for creating effective radio advertising, it is nonetheless apparent that two factors in particular, when working together, are linked to a higher Awareness Index.
Branding
Of all the diagnostic measures tested, a high level of branding showed the strongest relationship with overall advertising impact.
It should be noted however that branding radio commercials does not necessarily equate to the number of brand name mentions within an execution. Indeed, the best performing ad amongst those that were tracked by the research, that for Brand A, had comparatively few name mentions. Rather it was the feel, content and tone of voice that singled the ad out as being unmistakably that for Brand A.
There is a link here with advertising heritage. If a brands radio advertising uses a branding device or style which has already been established in earlier campaigns, the link is likely to happen in the listeners mind that much more efficiently.
Mechanisms that can help establish strong brand linkages RAB observations/ well-known examples
Name mentions The basic tool; always useful
Sonic Brand Triggers Memorable sounds, e.g. Intel; also theme music, catchphrases
Spokesperson Need not always be identified, can just be a “recognised voice”
Tone of voice Example: VW dry, understated
Ad structure or format Example: Hamlet Cigars
Power of benefit A brand with a truly motivating proposition will be deliberately remembered by consumers
source: Millward Brown
Likeability
Although the relationship is less direct, producing an advertisement consumers find enjoyable also shows some signs of leading to greater impact.
Again, this perhaps makes sense since the more enjoyable an ad, the more involving it is likely to be and accordingly, the more likely it is to be consigned to memory.
The conclusion from this study, therefore, is that those ads that are able to combine the elements of strong branding with likeability or enjoyment are those best positioned to be effective at driving advertising awareness. Importantly, it seems that being successful on only one of these attributes does not guarantee success, as the table below highlights.
Furthermore, even when these two factors are working together, memorable advertising is not necessarily assured as Brands H and, in particular, Brand L highlight. Notable is the fact that the advertising for these two brands scored highest in terms of having been heard by people before. This perhaps suggests that the ads have for these brands have simply worn out and so are less able to continue to cut through, thus making a case for the use of creative variation.
Likeability
| Brands | Radio Awareness Index | Branding | Likeability | Heard before | Similar to TV |
|---|---|---|---|---|---|
| Average | 3 | 64 | 13 | 29 | 45 |
| A | 6 | 87 | 13 | 53 | 81 |
| B | 5 | 67 | 13 | 11 | 30 |
| C | 5 | 81 | 30 | 45 | 80 |
| D | 4 | 61 | 11 | 9 | 14 |
| E | 3 | 53 | 7 | 37 | 45 |
| F | 3 | 49 | 3 | 33 | 25 |
| G | 3 | 61 | 17 | 12 | 61 |
| H | 3 | 85 | 12 | 78 | 74 |
| I | 3 | 54 | 4 | 22 | 52 |
| J | 3 | 58 | 20 | 33 | 55 |
| K | 3 | N/A | N/A | N/A | N/A |
| L | 2 | 92 | 27 | 73 | 87 |
| M | 2 | 47 | 11 | 5 | 24 |
| N | 2 | 59 | 15 | 20 | 39 |
| O | 2 | 59 | 9 | 16 | 18 |
| P | 1 | 60 | 5 | 12 | 20 |
| Q | N/A | 53 | 6 | 3 | 16 |
Implications for radio research
A challenge of working with radio advertising sometimes is that its effect can be hard to isolate, leading to questions about its accountability in a mixed-media schedule.
This long-term test demonstrates clearly that the effect of radio is measurable, if measured correctly.However it also flags up the problem, which is that many radio listeners attribute their awareness of advertising to TV. This section summarises the issues surrounding misattribution, and offers advice for offsetting it in research.
Misattribution
When asked to think about advertising, most consumers turn to memories of TV. As a consequence it seems that consumers responses may result in an underestimation of the cut-through of radio, whilst overplaying the impact of television.
This is most clearly demonstrated by looking at Brand C see Chart Six. At the time of the research, this particular brand had not had any recent television activity. Yet when informants were asked whether or not they had seen any television advertising recently for the brand there was a clear uplift in response from people in Coventry, the area in which the radio activity was present (but where there was no TV activity).
In contrast in Derby, the area in which there was neither TV nor radio activity, the TV advertising awareness line continues its gentle decline, as one would expect. In theory, this line should have been similar for respondents in Coventry.
A number of other brands exhibited similar patterns of response, with “reported” TV advertising awareness rising at the same time as the radio ads were aired. However, it is worth noting that not only did the extent of misattribution vary from brand to brand, but also for some brands misattribution did not seem to be present at all.
When misattribution is likely to occur
Analysis of all brands involved seems to indicate that misattribution is most likely to occur:
When the radio creative is particularly impactful
When a brand has a strong history of TV advertising, whilst having lower associations with radio.
Conversely, it seems less likely to occur:
When the brand has no strong history of having used TV
In addition, misattribution is less easy to detect when the radio activity is run concurrently with a large amount of activity on television.
Misattribution from TV to radio is uncommon, but did happen to one brand in the sample that has a strong history of advertising in both media.
Offsetting misattribution
The fact that this study is able to evidence the phenomenon of misattribution demonstrates that research, when properly structured, can take account of consumers difficulty in placing the precise source of the advertising to which they are exposed.One solution is to disregard respondents claimed source of advertising awareness and concentrate solely on total advertising awareness.
However, if it is deemed desirable to identify the precise source from which advertising awareness has been generated then the research solution lies with splitting the sample into two groups:
Listeners:
target consumers who have been listening to the stations on which the brands radio advertising has been carried. These people form the test group of respondents.
Non-listeners:
these consumers form the control sample and are target consumers who have not been listening to those stations but who, in all other respects, are the same to the test group e.g. they are similar in terms of other media habits and demography. Since the only difference between these two consumer groups is their radio listening, any differences in their awareness or in their attitudes to the advertised brand can be reasonably attributed to the radio advertising – regardless of where they think they have seen or heard the advertising.
Appendix: Methodology
This RadioLab project was a continuous study, running for 26 weeks from 27th September 1999 to 9th April 2000.The research was conducted in two locations within the Central ITV region: Coventry and Derby. During the research period, whenever a participating brand used radio, whenever possible it would go on air in only one of these two locations. In this way, findings from the two areas could be compared thus making it possible to isolate the effect that radio might have had. In other words, one area would act as a test area whilst the other would be the control.
Since any TV activity running in the Central ITV region would be seen in both Coventry and Derby, any differences in awareness or image found to exist between these two locations should be caused by the only variable difference – radio.
The sample comprised adults aged between 16 and 44. Every four weeks, 800 adults were interviewed by Computer Aided Telephone Interviewing (CATI), equally split between Coventry and Derby.Quotas were set in order to ensure that neither males nor females made up more than 60% of the sample. Similarly, quotas were set to ensure that a minimum of 40% of respondents fell within each of the following age breaks: 16-29 year olds and 30-44 year olds.
Lastly, within each of the two research locations, interviewers were asked to ensure that around half of all respondents were listeners to specific Commercial Radio stations. In Coventry, these stations were Mercia FM and Classic Gold 1359. In Derby, the specific stations were Ram FM and Classic Gold Gem.
Response to the advertising activity of seventeen brands was tracked during the period of the research. All brands were clients of Universal McCann and were:
Allsports
Bacardi Breezer
Coca Cola
Diet Coke
Cheerios
Fanta
Lilt
Metz
UPS
Branston Picklev
Honey Nut Shredded Wheat
Powerhouse
Wickes
Nescafe
Snackstop
Somerfield
Kwik Save
Broadly speaking, the questionnaire had seven sections:
Saliency
“I am now going to read out a list of different brands and Id like you to tell me which brands you have heard a lot about recently”
Purchase consideration
“Thinking about the same brands, I would like you to tell me which you would consider buying for yourself or for others in the future.”
Total advertising awareness
“Now I would like you to think about all the different places you may have seen or heard advertising recently, such as TV, radio and newspapers. For each brand I read out, I would like you to tell me whether you have seen or heard about it anywhere recently.”
Advertising awareness by medium
“And did you see Brand X advertised on TV recently?”
“And did you hear Brand X advertised on the radio recently?”
“And did you see Brand X advertised in newspapers or magazines recently?”
Diagnostics
Ad recognition
“Have you heard this ad before today”
Enjoyment
“How much will you enjoy hearing this advert each time you hear it on the radio?”
Branding
“The advert was for Brand X. There are some adverts that people remember but never know which brand they are for. Which of these phrases applies to this advert?”
Ease of visualisation
“Some radio advertisements create strong impressions so that you can easily picture whats happening, whilst others are far more difficult to picture. How easy is it to picture whats happening in this ad?”
Attitudes towards the brand
“I am going to read you some phrases and for each one please tell me whether or not you feel it applies to this advert.”
Similarity to any TV advertising
“How much does this advert remind you of a TV ad for the same brand?”
Image statements (variable for each brand)
Demographics