How Radio can increase sales by 9%
Preface by Tim Mason, Marketing Director, Tesco
“When the RAB approached me with an offer to get involved in their latest research project measuring radio’s effect on sales, I initially wondered ‘Why me?’ When they explained that the project was to be run by dunnhumby however, based on analysing purchase behaviour amongst Tesco Clubcard users, I was happy to contribute. dunnhumby are experts in the field of segmenting and developing understanding of customers in order to increase their value to a company. Tesco are a majority shareholder – we believe that their ability to interpret data at an individual consumer level offers leading edge research solutions for us, and all of their other customers. At Tesco we constantly use learning from dunnhumby analysis to inform the decisions that drive our business forward. I’m therefore delighted that this latest study by the RAB allows other advertisers to benefit from this unique research. The RAB study has brought together sales learning from an impressive list of 17 brands from different product categories, providing a valuable indication of how radio drives short-term sales at a macrolevel within the fmcg sector. I hope that you find the results as enlightening as I did”.
The Key Conclusions
Radio advertising creates an average sales uplift of 9%
Radio advertising creates an average sales uplift of 2.2% per 100 radio ratings
Radio can enhance the effect of a brand’s price promotions
Radio can minimise the effects of competitor price promotions
Creativity appears to be the single most important variable in the wide range of results
Executive Summary
How and why the study was done
The Radio Sales Multiplier Study was designed to measure the effect that radio advertising has on sales. This was done by analysing sales performance in comparable areas, where one area had been exposed to radio advertising and the other had not. The brands in the study are all fast-moving consumer goods, with a range of purchase cycles and prices: Bird’s Eye Potato Waffles, Chicken Tonight (Sizzle & Stir), Comfort Easy Iron, Comfort Fabric Softener, Dove deodorant, Dr Pepper, Fairy liquid, Head & Shoulders, Jacob’s Cream Crackers, Jaffa Cakes, Kellogg’s, Mini Cheddars, Müller Corner yoghurts, Nescafe Gold Blend, Peperami, Red Bull and Robinsons Barley Water. Results for individual brands have been kept confidential.
The study was conducted by dunnhumby, who manage the data in Tesco’s Clubcard database. The brands selected for the study had to meet certain requirements:they had to have a history of radio advertising in the past two years which allowed dunnhumby to define suitable test and control areas; other media activity had to be balanced between the test and control areas, as did the in-store activity (promotions as well as store refurbishments etc). In the end seventeen brands made up the study, from an original shortlist of over forty.
The study only measured the effect of radio. The Tesco Clubcard database could be used to examine the effects of advertising in other media, but this would require different active and dormant periods for each medium and was therefore not feasible using historical campaigns.
The Results
Sales increases
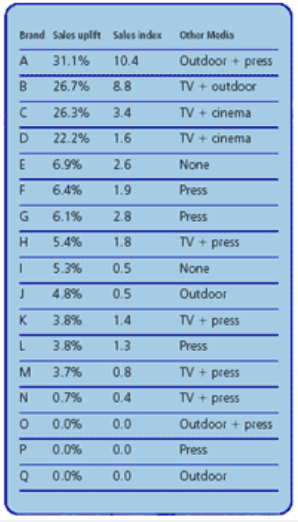
The increase in sales attributable to radio advertising ranged from 0% in some cases to a high of 31%. The average increase was 9%: in other words the value of sales for the brands in the areas where radio was used was on average 9% greater than the control areas where no radio advertising ran.
Sales increases per 100 ratings
However these figures take no account of the weight of radio advertising &endash; it might be expected that a heavier advertiser would see a bigger uplift. To analyse this, sales results were compared to the total radio ratings used by the brands in the test area during the test period. This was expressed as the percentage of extra sales generated for each 100 gross rating points (GRPs).
The average uplift in sales for each 100 GRPs was 2.2%.
Radio offsetting a rival’s price promotion
The Tesco Clubcard database also records which items are on price promotion during the test, and this allows analysis of the way radio works in conjunction with price promotions.
In the case of brand I, a rival Brand was on price promotion.
In the non-radio areas this saw Brand I’s sales depressed by around 9% but in the areas where the radio advertising ran, this effect was offset, with sales slowing by only 3%.
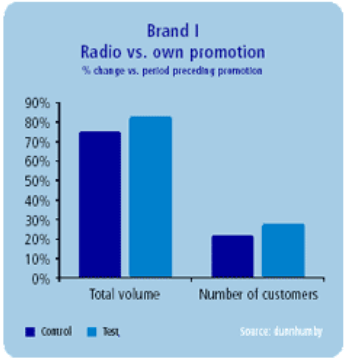
Radio accelerating a brand’s price promotion
Following the competitor promotion, Brand I then ran its own price promotion. In the area where Brand I was running the promotion, there was a 21% increase in the number of people who bought the brand at that time.
However in the areas where the radio advertising was running, this increase rose to 29%, showing that radio has an uplift effect on such promotions (the radio advertising was not linked to the price promotion &endash; it was a broader brand message).
The importance of creativity
There are a number of variables that could account for the very different performances of different brands in the test. Some of the brands that scored 0% may be less responsive to advertising in total. Spotlength does not seem to be a deciding factor, as the higher and lower achievers were all a mix of timelengths.
But the higher achievers were characterised by being very clear in their message, being very well branded and often having a common theme across different advertising media. The lower achievers were characterised by complexity (listeners being asked to do a lot of work) and tangential linkage to the brand and its message (wordplay in the ad rather than an idea).
Using the findings to inform planning
FMCG advertisers can use the average sales index to estimate the potential uplift in sales for their own campaigns. Alternatively, they can apply the same research methodology to evaluating their own campaigns. Finally, the diagnostic findings can help advertisers optimise campaign effectiveness.
Background & Rationale
The Sales Multiplier is the latest in a series of studies into the effectiveness of radio advertising, and fills a gap in the body of knowledge.
It basically set out to answer the question ‘How effectively does radio drive sales?’ The importance of sales as an area in need of better understanding was dramatised in Ocean Consulting’s 2002 report for the RAB. In this they presented the various levels at which effectiveness could be interpreted – see pyramid diagram above. Some of these have already been addressed by past research.The Awareness Multiplier, conducted by Millward Brown and published in 2000, focused on radio’s ability to generate advertising awareness . This showed that radio was threefifths as effective as TV on average, but at one-seventh of the price – making radio therefore potentially four times as cost-effective.
It also demonstrated the ‘multiplier effect’ – that the effectiveness of a TV budget could be improved by as much as 15%, simply by redeploying 10% onto radio.
There has also been extensive work into radio’s ability to drive direct response. The most important study in this area was the joint GWR/BT/DMA study of telephone response in the mid-nineties, which demonstrated how widely response rates varied for different brands.
The way radio can change attitudes to brands is documented in many case studies at RAB OnLine (rab.co.uk): for example Marston’s Pedigree, Kellogg’s Nutri-Grain and Listerine. Each of these case studies is different in scope and content, and it’s not possible to devise averages in terms of changing brand perceptions.
In terms of sales there are also some useful case studies – for example Soft & Gentle – but again it is impossible to draw averages out of the material. This is mainly because case studies are based on commercially sensitive information, and exact sales effects tend to be indexed or disguised to protect confidentiality.
So there was a need for more understanding of radio advertising’s effect on sales. Particularly since the intermediate measure of awareness (although known to be linked to sales) is often seen as ‘soft data’ where sales figures are seen as ‘hard data’.
Importantly this is a test of radio’s effect, not of other media. It would be possible to track the effects of other media using this methodology, but it would need a separate project with different active and dormant periods planned for each medium.
We had hoped to include data for other media, especially TV, as a comparator for the results, but unfortunately there are no results in the public domain which offer the same level of detail.
The only comparable figures appear to be those recently published for TV in the Financial Times, where it was noted that
the “average sales increase for packaged goods resulting from TV advertising fell from 5.9% in 1999/2000 to 3.9% in 2001”
(quoted source: Starcom Motive/Taylor Nelson Sofres).
How the study was done
In simplified terms this study consisted of reviewing historical sales (using EPOS data from the Tesco Clubcard database) for brands advertised on radio in two comparable regions.
For each brand, one of the two regions received radio advertising, while the other did not. Other media activity was common across both areas.
This allowed us to identify, in terms of short-term sales, how much effect was generated by radio.
2.1 Who conducted the research?
Our partner in this research was dunnhumby Retail, the customer-marketing consultancy, who run the Tesco Clubcard database.
dunnhumby provided access to the Clubcard data, allowing them to analyse the impact of historical fmcg radio campaigns on shopping habits, dating back to August 2000.
2.2 Selecting the campaigns for research
The analysis was based on reviewing sales data for historical campaigns, so how did we choose the campaigns to be included in the study?
Initially we looked at radio advertising brands across FMCG product categories on Nielsen Media Research (MMS) that would be available in Tesco stores. These brands had to be advertising between summer 2000 to summer 2002 as this corresponded to availability of dunnhumby sales data.
The brands were further filtered down according to whether suitable test and control regions for radio located within the same TV area could be identified.
Further to this there had to be a clear gap where there was no radio activity before the radio advertising commenced to establish the base sales relationship between the two regions.
Dunnhumby were then able to establish that sales in the chosen regions were robust enough to be analysed in this way and that in-store promotions were comparable between regions (in one particular case, they were even able to identify and isolate the destabilising effect of a store refurbishment).
This stringent ‘pre-check’ meant that of 40+ campaigns initially considered for the project, less than half were deemed appropriate for the final analysis.
2.3 Attributing sales to radio
To calculate the uplift in sales attributable to radio, dunnhumby started by identifying the differences in customer spend between the Test and Control regions in the period before the advertising took place. This provided information about the differences in purchasing habits between the two customer groups during a period of no radio advertising.
This difference was then used to calculate an expected customer spend in the test region based on changes in sales in the control region across the period when the radio advertising was active.
The difference between this expected customer spend and the actual spend in the test region identified the uplift that could be solely attributed to the effect of radio advertising, as this was the only variable between the two regions.
The radio sales effect
3.1 The range of sales effects
Of the final 17 brands included in the study, 14 showed a positive effect on sales due to radio advertising, the highest recording an impressive 31% increase. Three of the brands meanwhile showed no discernible sales uplift attributable to radio. The average uplift across the 17 brands was 9%.
3.2 Efficiency of driving sales
The pure sales uplifts take no account of the weight of activity behind the different brand campaigns. To get a better perspective on radio’s efficiency in driving sales, each of the sales increases were re-calculated as a Sales Index – in other words, how much do sales go up for every 100 ratings employed. To put this into context, it is like a sales-based equivalent of the Millward Brown Awareness Index.
The Sales Index Range chart therefore shows the sales increases that each brand achieved for every 100 adult ratings. Across the 17 brands there was a range of scores between 0 & 10.3, with the average Sales Index calculated at 2.2. So, based on this analysis, an average radio campaign might expect sales growth of 2.2% for every one hundred 30”-equivalent adult ratings run on radio.
It is important to note that these results relate only to short-term sales uplifts. Radio advertising is also proven to benefit brands in other ways not measured in this test, such as building brand awareness, improving longer-term brand loyalty and enhancing brand image. Whilst shorter, medium weight campaigns tended to be slightly more efficient in generating short-term sales, longer heavyweight campaigns are more likely to be effective in driving these other measures, in addition to uplifting short-term sales. For further information on how radio advertising influences these softer measures, please see Radio Awareness Multiplier Study and the case study database at RAB onLine (rab.co.uk).
3.3 Variations between brands in the test
It is clear from these results that radio advertising does indeed drive product sales, but given the range there are obviously other factors that influence the sales outcome – why do some brands see very significant sales increases whilst others have no discernable uplift?
One answer lies in the fact that different products have different sensitivity to advertising. This may be influenced by many factors, for example purchasing loyalty and product purchase cycles. So, whilst some brands might naturally expect a large short-term response to advertising, regardless of media used, others will experience little or no response.
As with the Radio Awareness Multiplier Study, another crucial variable in delivering success is creative content. It is important to note at this stage that all of the radio commercials for the brands included in the study were brand-focused none of them were highlighting on-pack or price promotions that were running at the time.
Radio in combination with price promotions
As this was a study into the FMCG market, it was not surprising that there was price promotional activity (own and competitive) affecting most of the brands in the sample.In all cases the promotional offers were constant between test and control region, but interestingly purchasing behaviour was not.Due to the complex nature of the promotional calendar, with many promotions on competitive products overlapping, it has not been possible to isolate the radio effect alongside individual promotions in every case. However, where it was possible, there were some interesting findings on how radio advertising further influenced brand purchase behaviour alongside promotions. For example, the results on Brand I (detailed later in this section) were particularly enlightening.
4.1 Price promotions vs. advertising
The first learning that we gleaned from the purchasing patterns on the promoted brands is that certain price promotions are able to deliver a much bigger short-term sales effect than advertising in any medium. However, it should be noted that the promotions that drive the highest volume tend to offer a heavier price discount to the consumer – which in turn means a bigger cost burden for the advertiser.
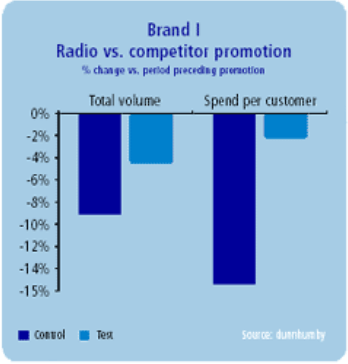
4.2 Radio vs. competitor promotion
When radio advertising commenced on Brand I, there were several competitor price promotions running in-store. Not unexpectedly, these had a negative effect on Brand I in terms of both volume of product sold and average spend per customer in comparison to the preceding period.
Interestingly, this negative effect appears to have been stemmed by the presence of radio advertising in the test region, particularly in terms of spend per customer where the decline is only 2% amongst those exposed to the advertising compared to the 15% downturn amongst those who didn’t hear the radio campaign.
4.3 Radio alongside a brand’s own price promotion
Following the competitive promotional activity, Brand I then ran a price promotion of its own. This had a significant uplift effect on sales in the control region, with volume increasing by 76% and number of customers purchasing by 21%.However, even this dramatic effect is enhanced amongst those exposed to the radio advertising. Of particular importance is the increased number of customers radio brings to the brand over and above the promotion. Whilst our study was only focused on short-term sales, it is interesting to speculate the value that these additional customers might represent to Brand I in the longer term.
4.4 Why does radio advertising influence the effect of price promotions?
These results intuitively feel highly appropriate. Listened to when preparing the shopping list and/or in-car on the way to the supermarket, radio offers one of the last opportunities for brand advertising to influence consumers prior to entering the store. Interestingly, there is evidence that backs-up this hypothesis.
The Newslink Recall Research suggested that if a listener is engaged in an activity related to the advertising they are exposed to, they are 65% more likely to recall the advertised brand. Coupled with Erwin Ephron’s Recency Theory that suggests that the last advertising impact prior to purchase is the most influential, it is evident why radio advertising can even affect the outcome of the seemingly all-powerful price promotion.
So, our study illustrates that radio can uplift the effect of price promotions, but what of other communication channels? Was there any learning we could glean from the research about the effectiveness of radio operating within different media mixes?
The effect of radio with other media
Brands are increasingly using mixed-media solutions. Initiative Media recently published an analysis showing that between 1997 and 2001, the percentage of the top 100 brands using four or more media had increased from 42% to 64% – a very significant shift.
Of the seventeen brands in the study, only two used radio alone. The rest used various combinations of TV, press, outdoor and cinema – as explained in the methodology the effects of these other media were balanced across the test and control regions, so the sales uplifts reported are only driven by the radio component.
In terms of findings, it may be significant that the highest performing brands in the test used at least three media in combination: there was also fairly strong synergy between the creative executions in each medium.
From the range of findings it appears that radio can work successfully in combination with a variety of other media. However there is not enough evidence here to suggest that any particular combination works better than others.
Diagnostics: What kinds of ads are more effective?
This project was not designed as a study into creativity, but it has been possible to review some of the ads that were in the campaigns with the highest and lowest scores.
The original Radio Awareness Multiplier Study conducted by Millward Brown showed that creative treatment could make a 500% difference to awareness generation scores, so it is worth considering this aspect of the campaigns. The following observations are inevitably subjective, and represent RAB observations rather than findings.
None of the ads in the sample represented exceptional creativity: they were all ‘conventional’ radio ads, using dramatised scenes, comedy, dialogue and voiceover announcements in various configurations.
It is also important to say that these were not particularly sales-driving commercials. Some had more focus on the call to action, but on the whole the emphasis was on classic brand advertising.
There was a mix of timelengths, with no pattern of differentials emerging there.
The highest achieving ads were characterised by…
| Character | Detail |
| Simplicity | a simple claim or offer which could readily be understood |
| Synergy | where the creative approach was one that was used across other media |
| Audio Branding | several of the top performers had very distinct audio branding |
The lowest-scoring ads were characterised by…
| Character | Detail |
| Complexity | sometimes the listener was being asked to do a lot of work to make the ad come to life, without sufficient reward in terms of entertainment |
| Tangential linkage | some ads dramatised phrases or ideas which were very weakly connected to the brand and its proposition |
7.1 Predicting the sales effect of your planned radio campaign
The findings from the research can be used to help predict the level of short-term sales uplift that you might expect from planned radio activity. This can be calculated by multiplying the planned campaign weight (30” equivalent GRPs) by the average Sales Index delivered across the brands in this study, as follows:
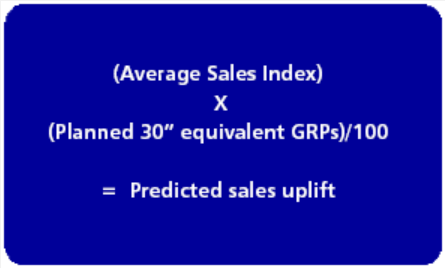
So, the predicted uplift for a 500 GRP campaign would be calculated as follows:

i.e. based on the average across all of the brands in this study, you might expect an 11% uplift in short-term sales from a campaign weight of 500 30” equivalent GRPs.
Clearly the above calculation is based on an average across different types of brands with different sensitivity to advertising. Based on your own understanding of how sensitive your brand is to advertising, you may view the resulting predicted sales uplift as either a hard or soft target.
7.2 Optimising effectiveness
Whilst it makes sense to plan based on the averages as detailed above, what factors can help you deliver a better than average performance?Beyond individual brand responsiveness to advertising, the other vital aspect in delivering a better than average sales effect was creativity.
As detailed in the preceding section there were common creative elements amongst the more successful campaigns and a different set of similarities across the poorer performers. In attempting to achieve a better than average performance from your campaign, it makes sense to consider which of the more successful elements (SIMPLICITY-BRANDING-SYNERGY) are present/would be appropriate within your own advertising.
7.3 Researching your own campaign using this methodology
Any advertiser (not just fmcg) that has access to sales data for their product by postal sector is able to replicate the methodology used in this study to measure the sales uplift of a specific radio campaign, providing that suitable test and control regions are identified.
dunnhumby even claim that extending this methodology by incorporating suitable active/dormant periods for each medium within a mixed media plan, will allow them to directly contrast the radio effect against that of other individual media.
The use of existing data, coupled with the test and control methodology, effectively negates the need for an expensive tracking sample. As a result, the overall costs involved tend to be lower than associated with traditional media campaign research, and are a small fraction of the average campaign cost.
As already mentioned, our study was by necessity an analysis of the short-term sales effect. Using the Tesco Clubcard data, dunnhumby are able to track the longer term behaviour of consumers who come into a brand because of advertising. Not only could this provide an insight into the cumulative effect of repeat advertising on the loyalty of these consumers, it could also provide valuable information on long term value of advertising.
Appendix
FAQ’s
1. Why didn’t you measure the sales effect of other media used in campaigns on the study?
We used the Clubcard methodology to monitor historical campaigns only. Because of this we were unable to set up the proper conditions for monitoring media other than radio.
2. Why did you only review short-term sales?
The Ocean Consulting survey highlighted the desire amongst advertisers and agencies alike to understand return on investment in above-the-line media and it was felt that short-term sales was the best measure of this.
3. What about other measures of success alongside sales?
As stated above, our main reason for conducting this research was to understand the effect that radio advertising could have on sales. Whilst additional understanding of how the radio advertising affected other measures may have developed our understanding of these sales effects further, the use of historical campaigns effectively precluded us from running parallel tracking studies. For information on how radio builds awareness/drives response/affects brand image, please see the original Radio Awareness Multiplier Study and the RAB case study database at RAB OnLine (rab.co.uk).
4. How does the radio sales uplift figure compare to TV?
As previously stated, we were unable to record sales increases compared to other media. The only comparable figure we have seen was taken from ITV’s own research into the subject, conducted by Taylor Nelson Sofres. In a recent article in the FT, Starcom Motive used this research to demonstrate that the average uplift from TV advertising in 2001 stood at 3.9%, regardless of weight – the closest comparative figure to our average radio uplift of 9%.
5. Is there any pattern of success arising from different media combinations?
As stated in Chapter 5, it may be significant that the highest performing brands in the test used at least three media in combination. With a limited sample for each media combination, it has not been possible to drill down beyond this learning.
6. Didn’t price promotions skew the results?
Where running, the price promotions were consistent in both test and control regions – the only difference between them was the presence of radio advertising in one – so any uplift from promotional activity would be equal across both regions. In addition, none of the radio ads referred to current price promotions/on-pack offers.
7. How did you select the campaigns for research?
The brands had to be advertising between May/June 2000 to summer 2002 as this corresponded to availability of dunnhumby sales data.The brands were further filtered down according to whether suitable test and control regions for radio located within the same TV area could be identified.
8. What about seasonality?
As with the price promotions issue detailed earlier, the use of test and control methodology effectively stripped out the variable of seasonality within the research – it was just another constant between the two regions.
9. How can I contact dunnhumby to discuss what they can do for my campaign?
dunnhumby can be found at:
Aurora House, 71-75 Uxbridge Road, Ealing, London W5 5SL
Telephone: 020 8832 9222
Contact: Andrew Hill, Products and Services Director